‘1,374 Days: My Life With Long Covid’
A data storytelling experience about a life-altering disease
Four years into the Covid-19 pandemic many aspects of the disease remain a mystery. While most people recover from the illness as though it were a bad flu or cold, others develop debilitating symptoms and lingering infections that stretch for months and even years. Long Covid affects an estimated 65 million people around the world. Yet there is still a sense of disconnection and minimization for sufferers.
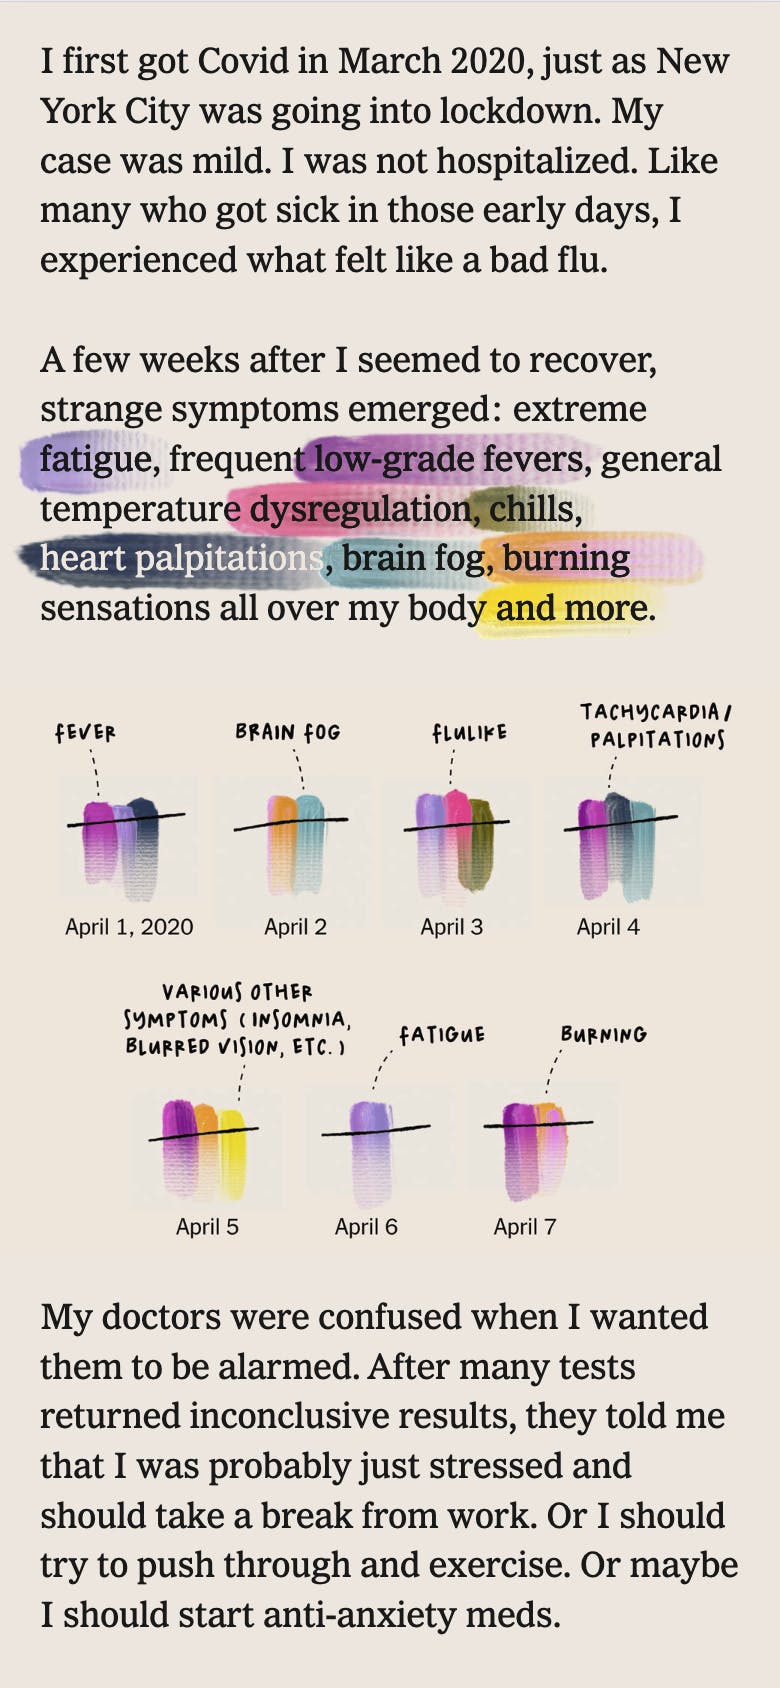
Pentagram partner Giorgia Lupi has experienced all of this firsthand. She first came down with Covid-19 in March 2020; three and a half years and two subsequent infections later, she is still dealing with daily symptoms that may range from fatigue, nausea and dizziness to severe headaches and nerve pain that make it difficult to function.
We worked closely with Giorgia and her team in a visual essay for The New York Times that uses data visualization to convey the overwhelming experience of Long Covid.
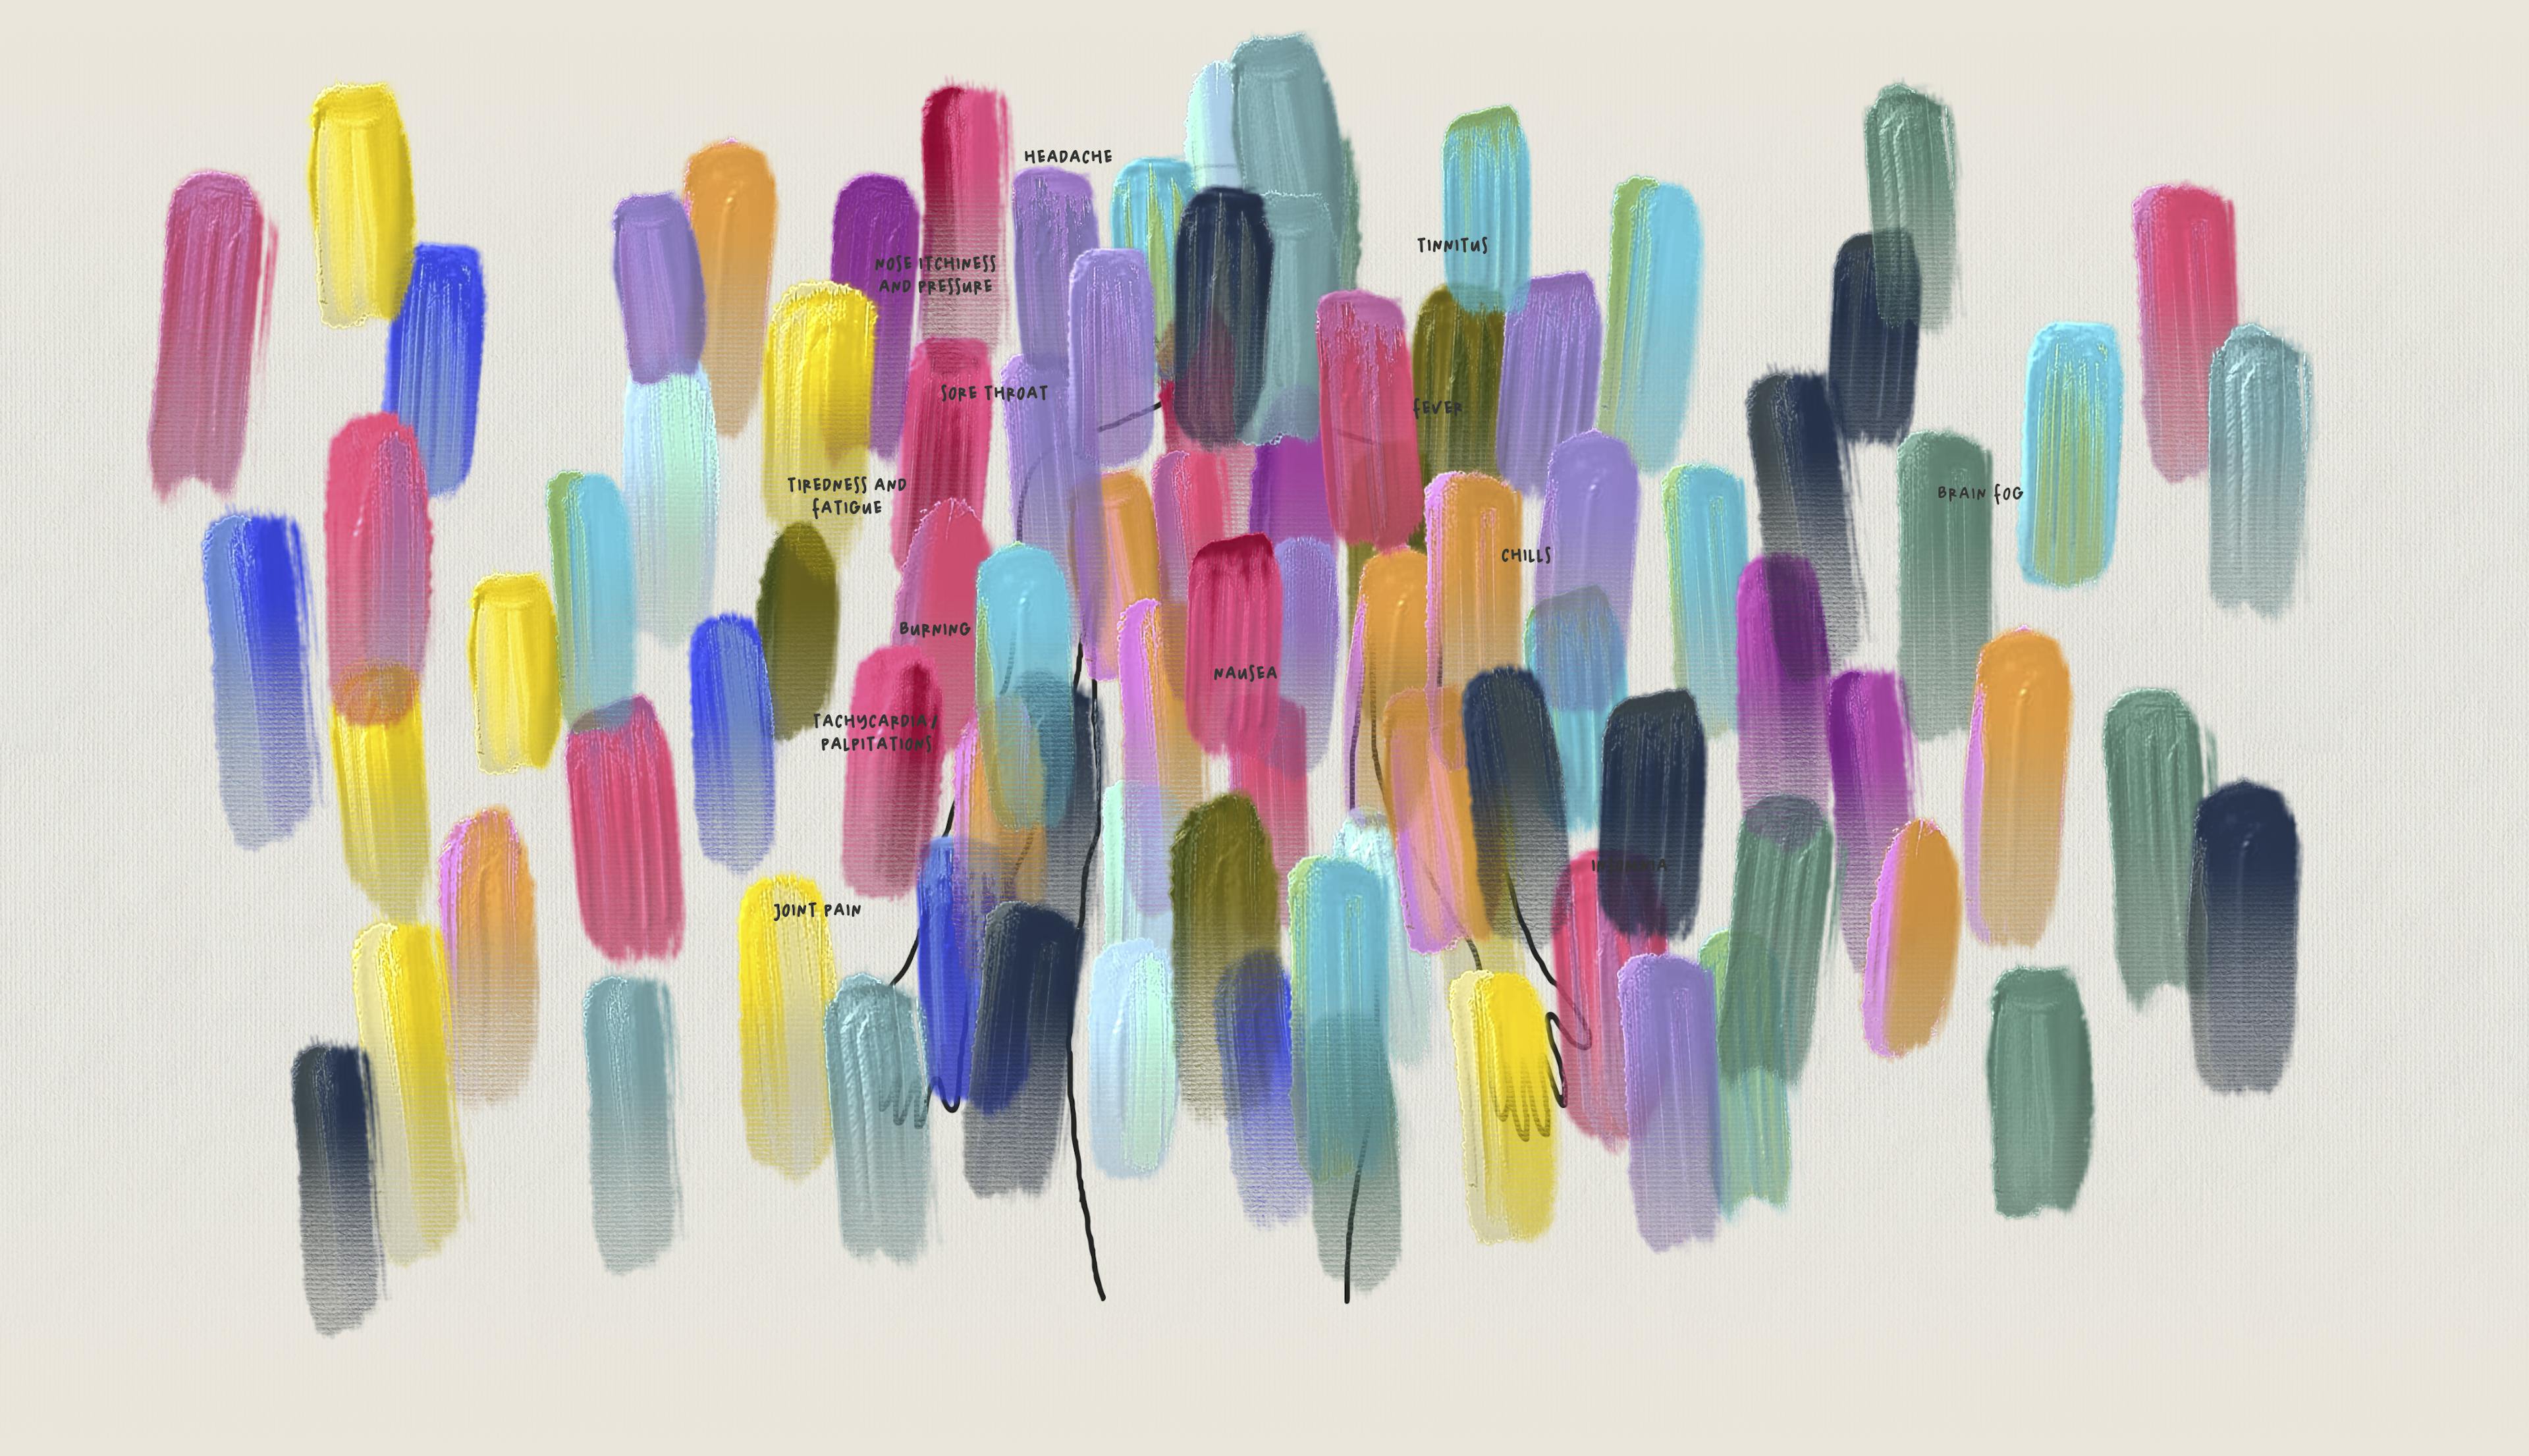
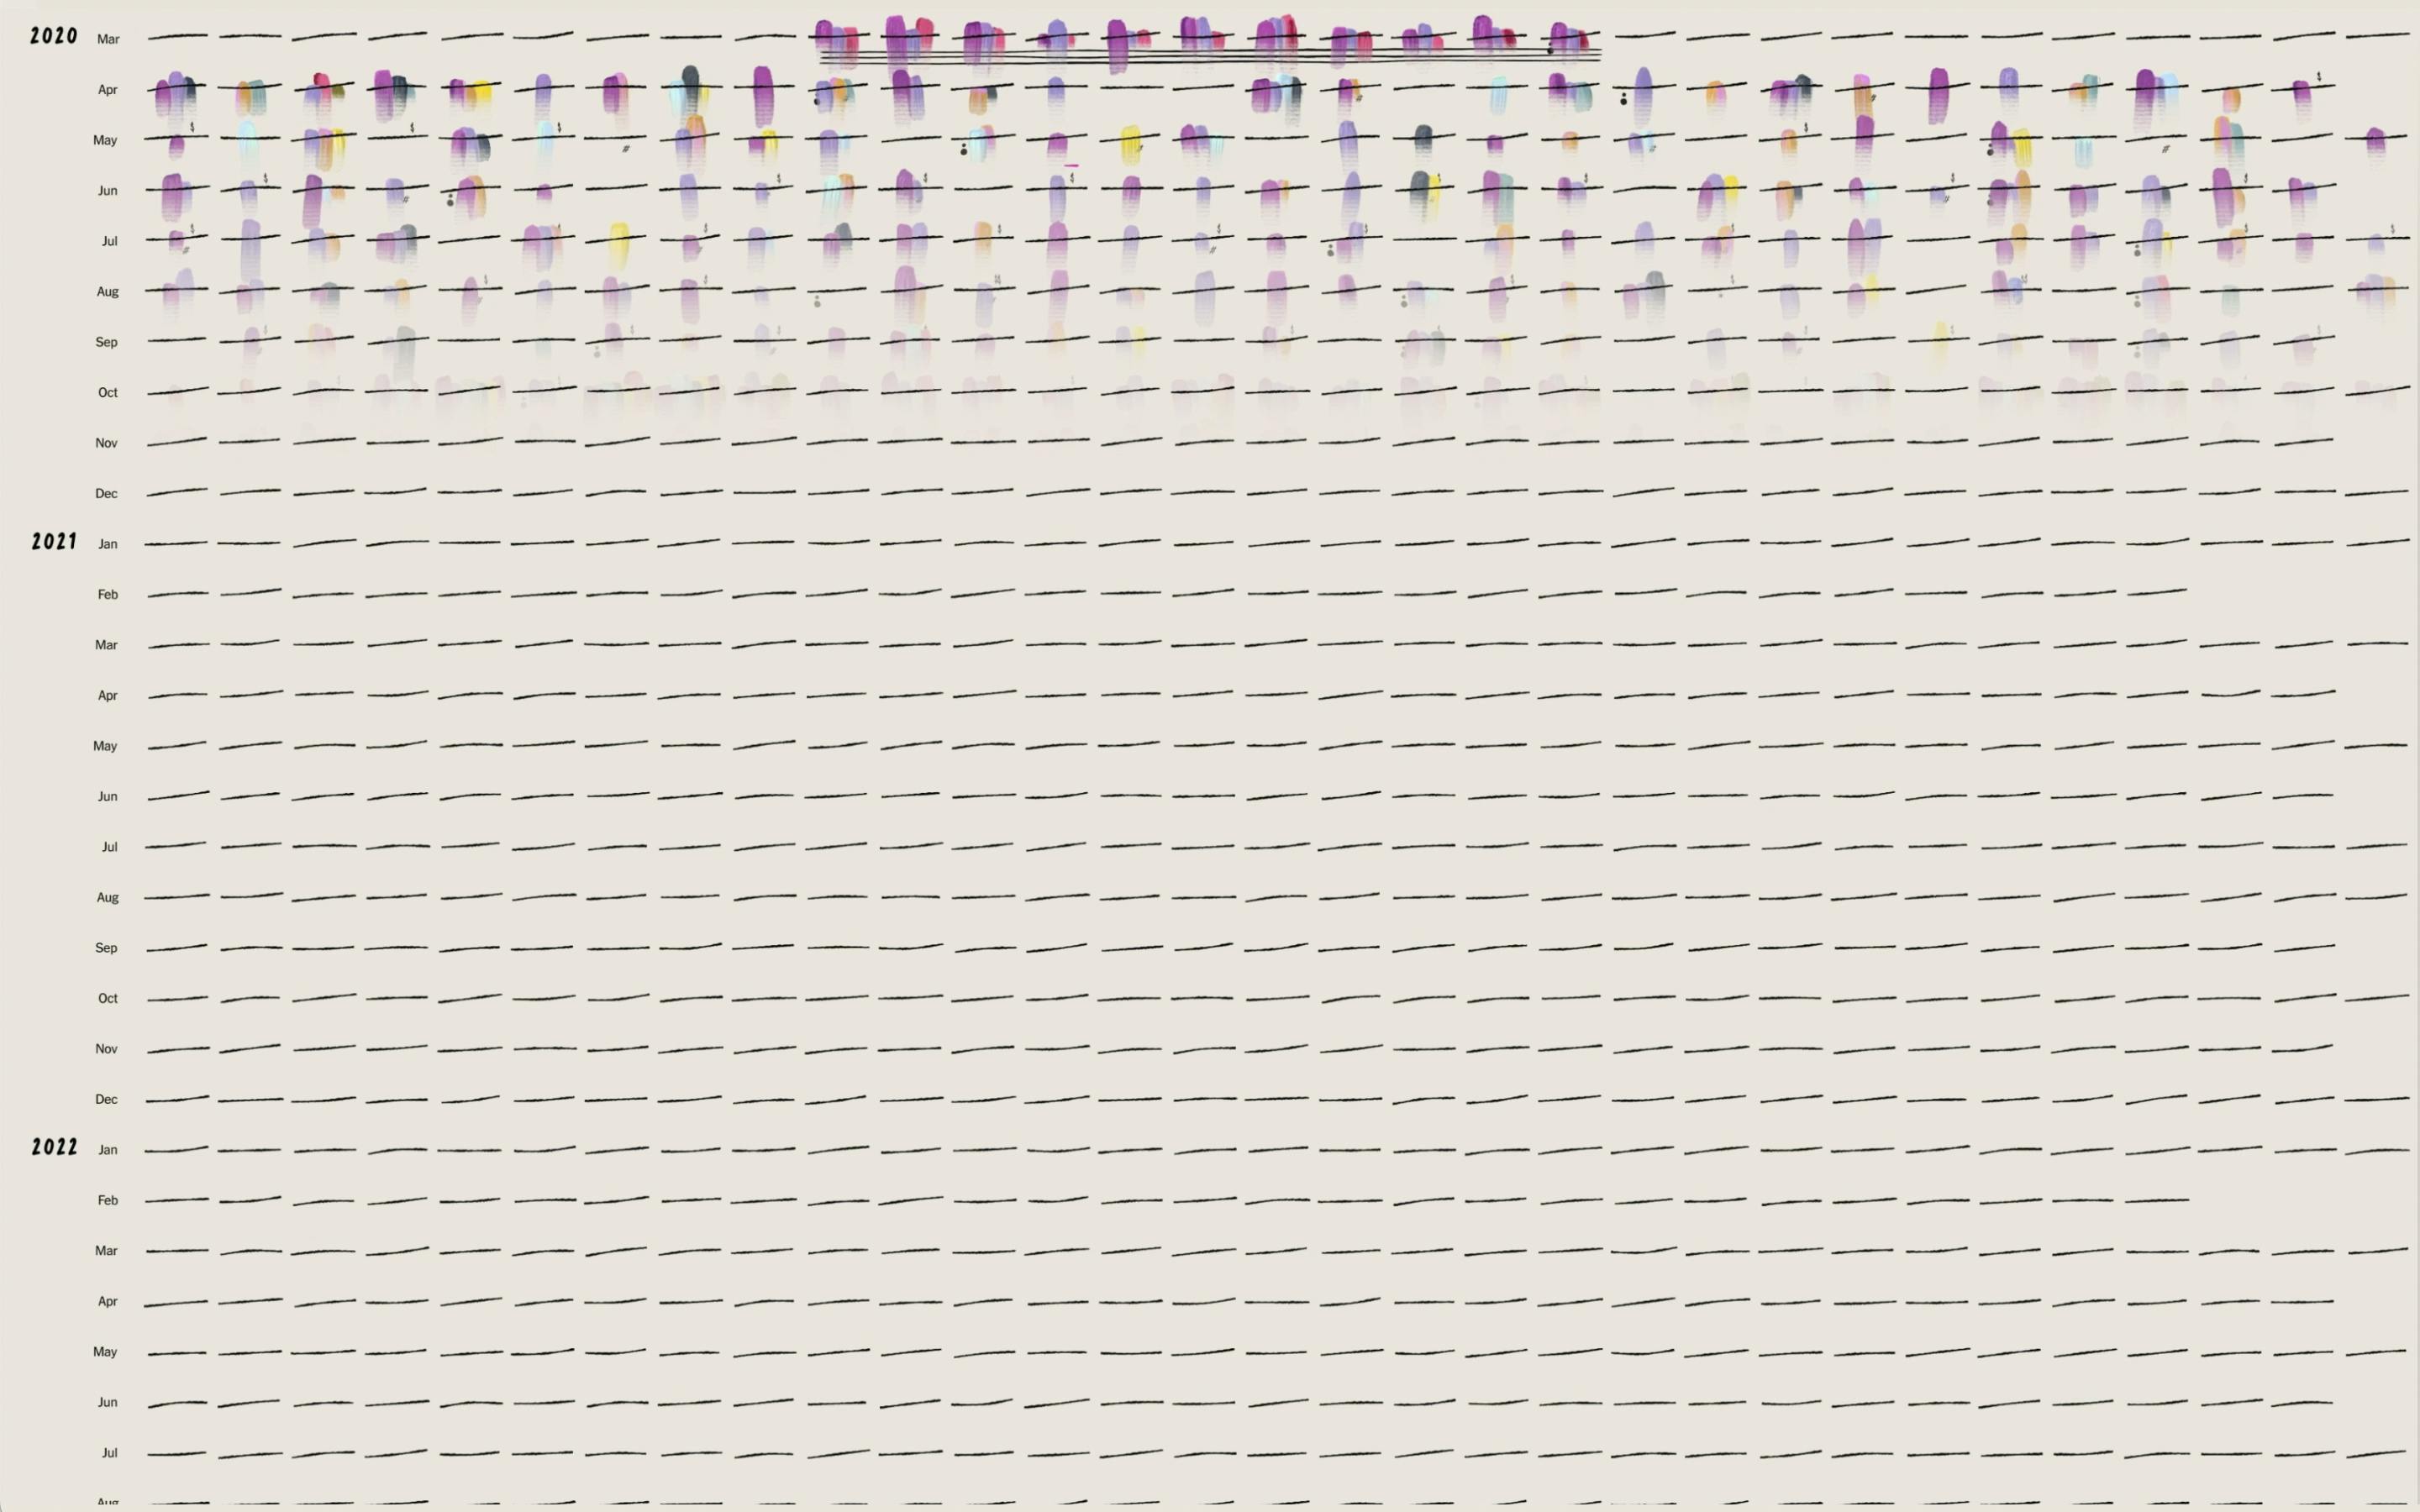
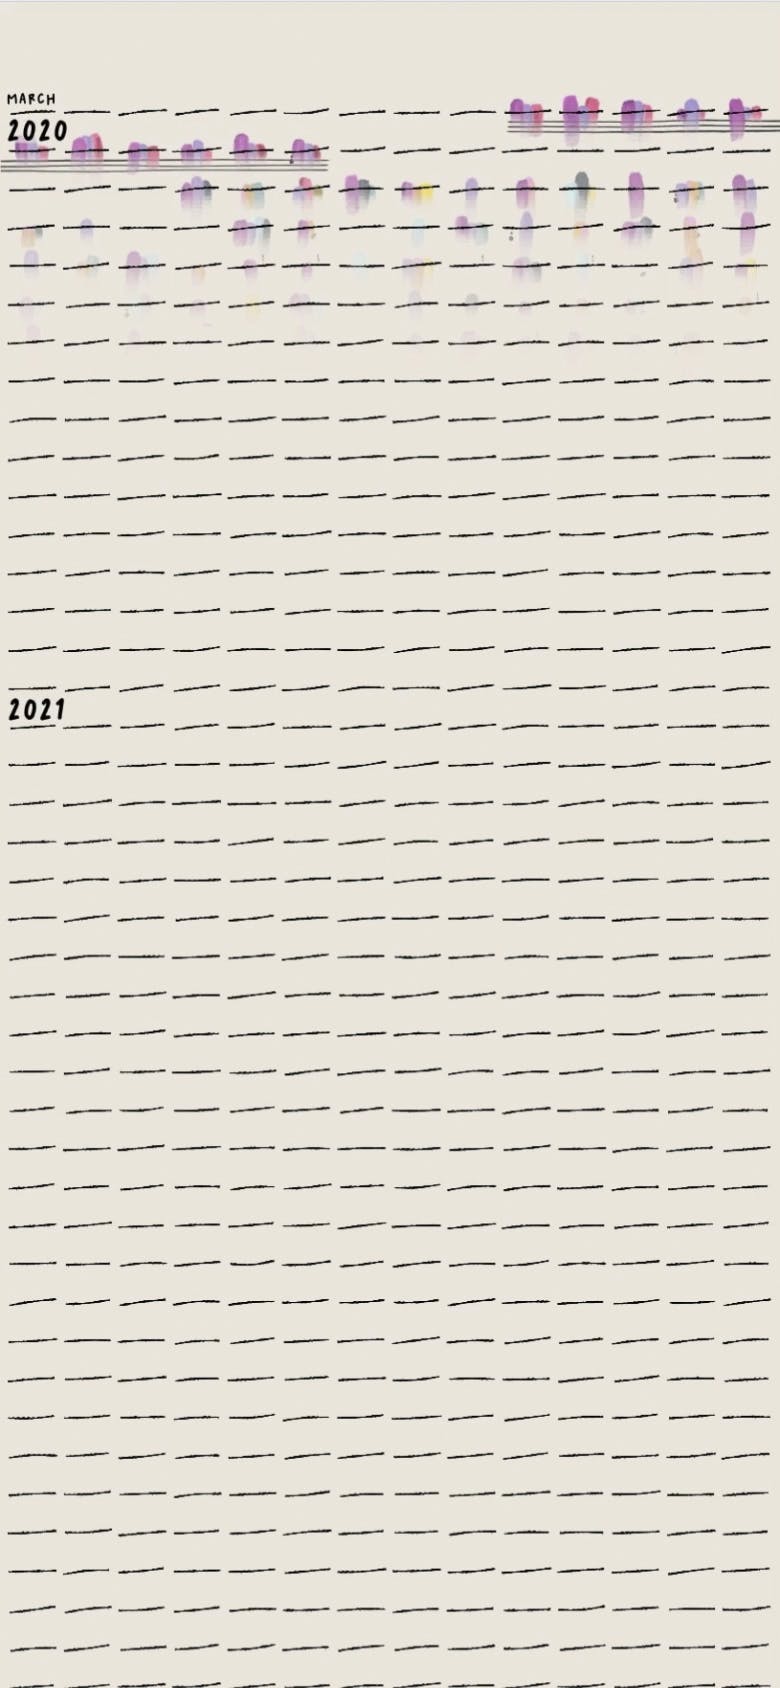
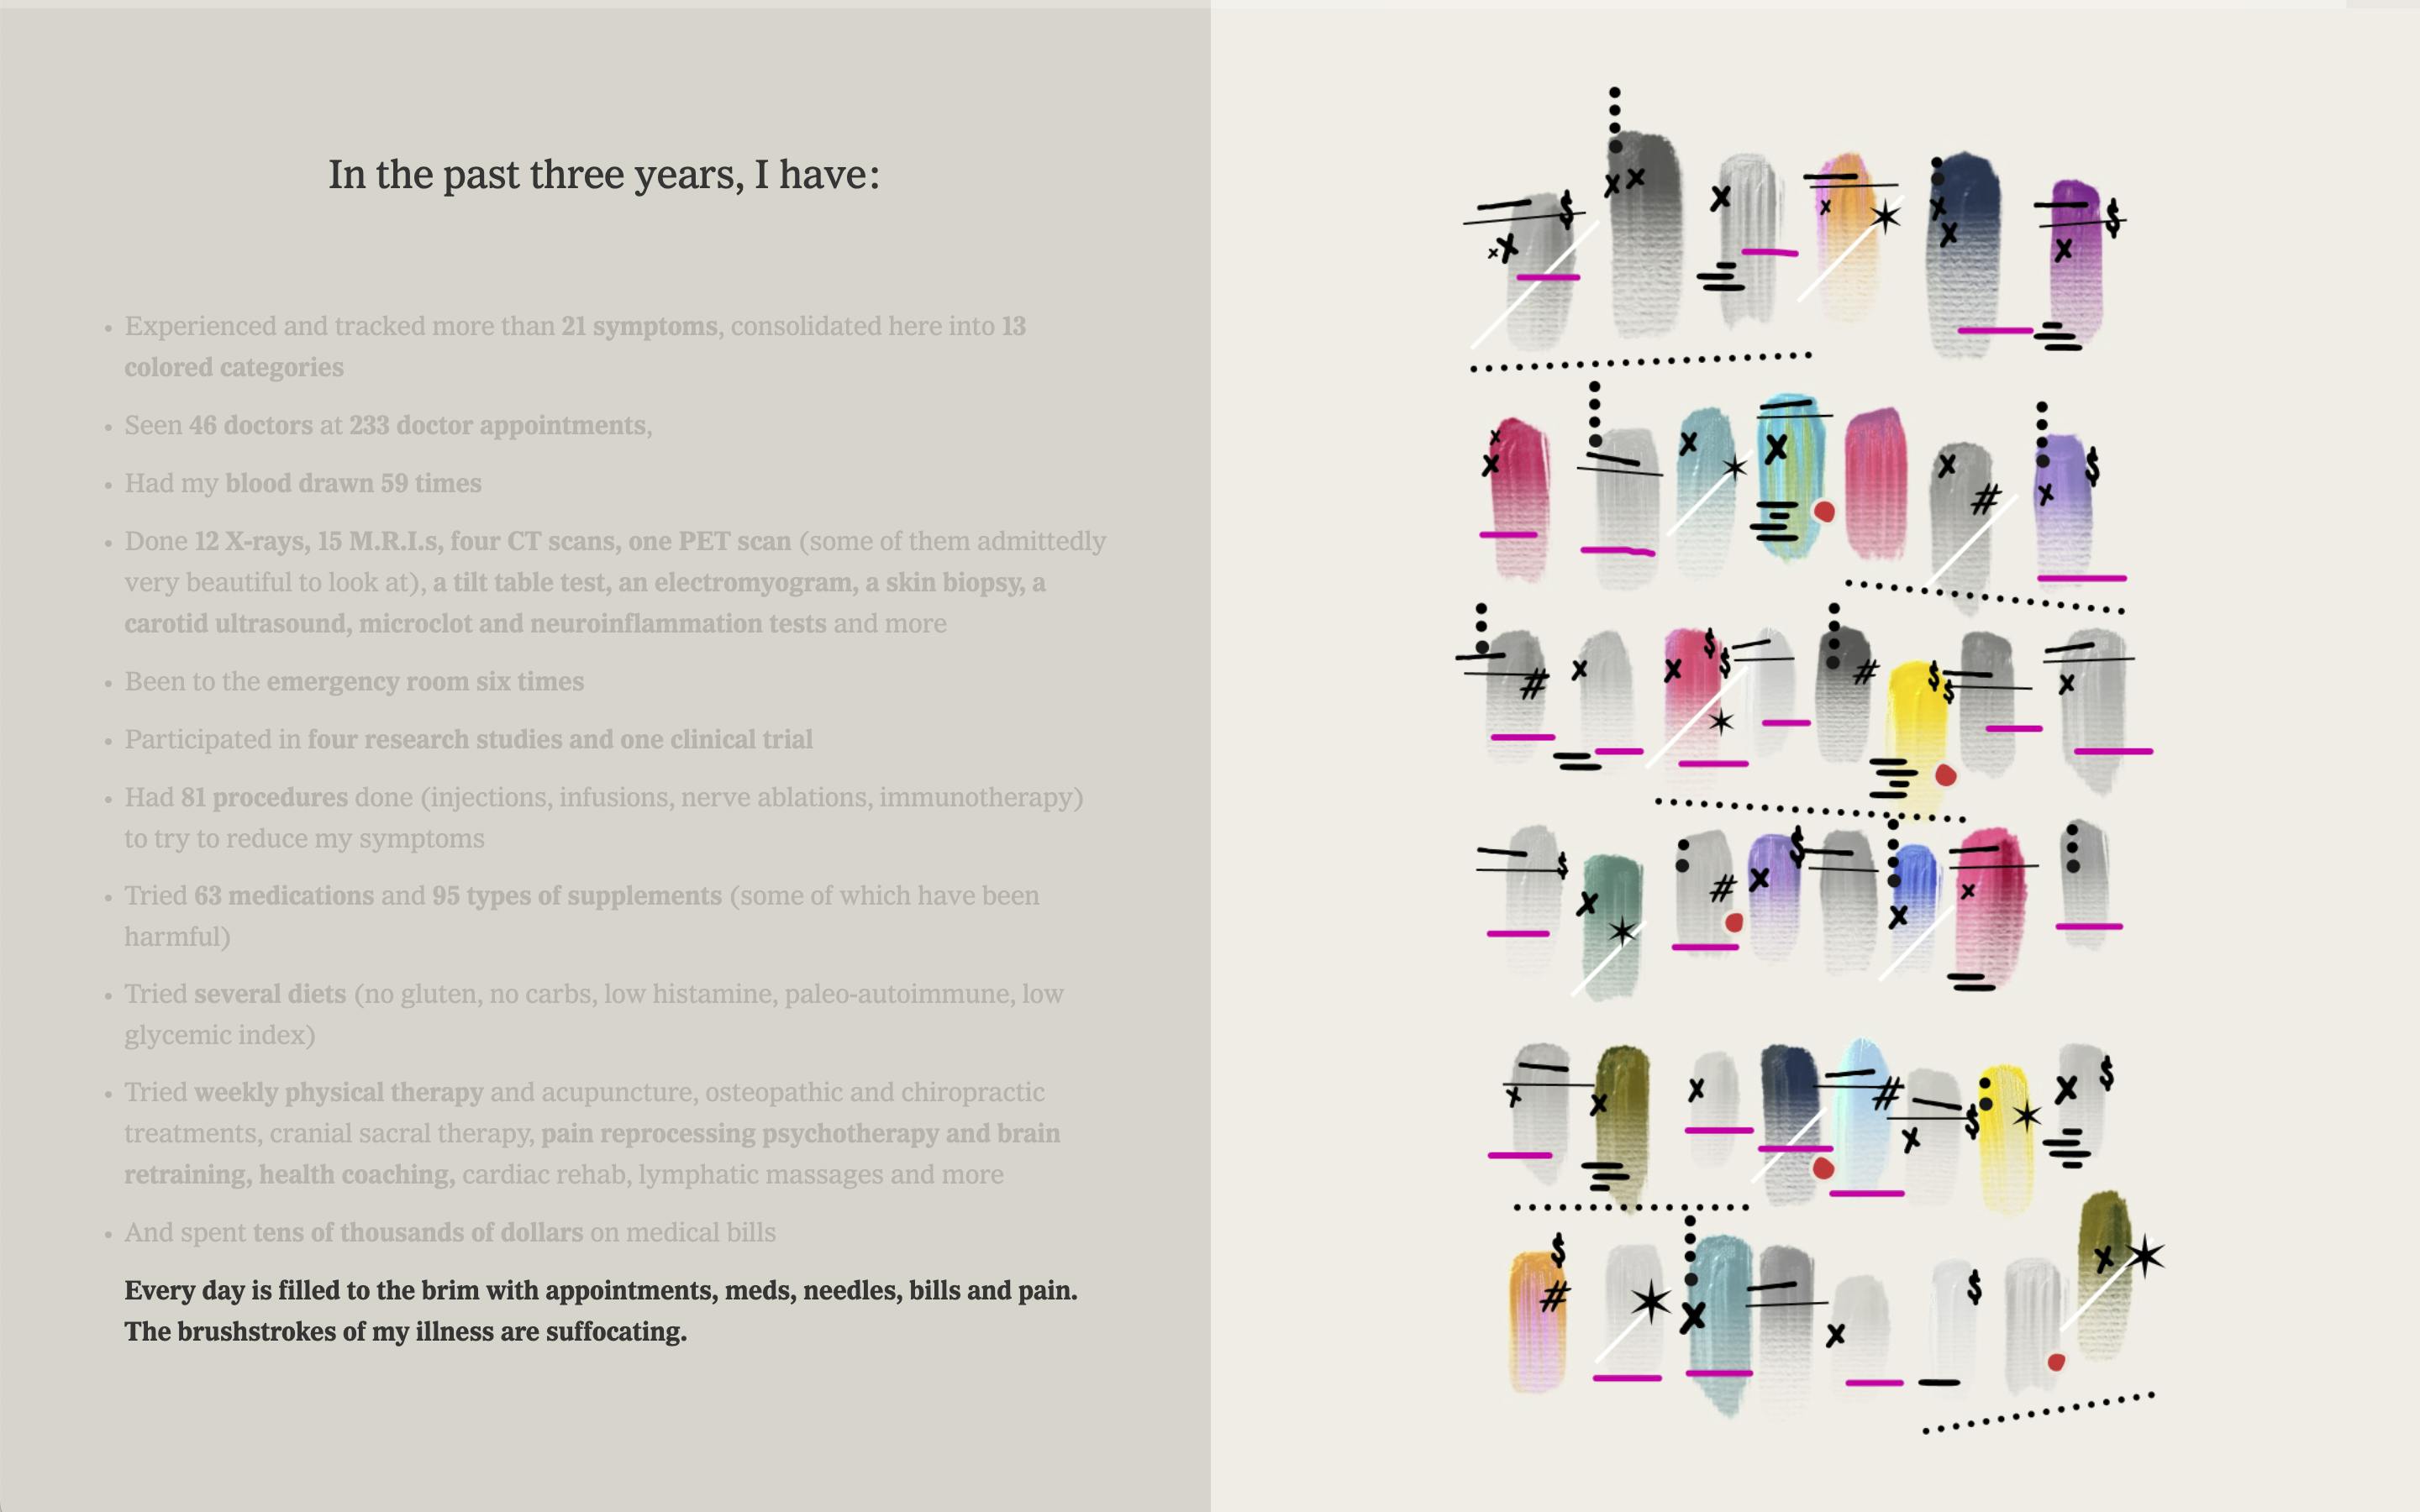
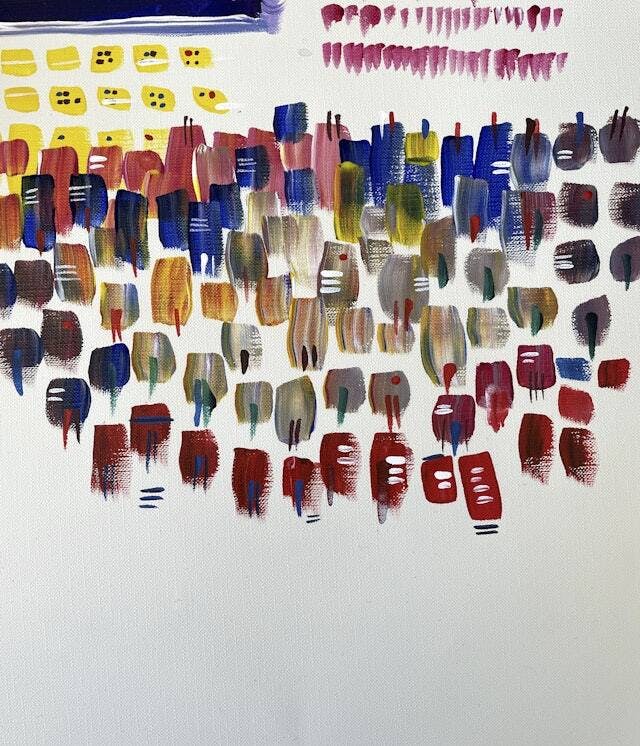
In the piece, Giorgia uses colorful brushstrokes of varying intensity to track her symptoms each day over the past few years. Seen all at once across the calendar, these dense layers of marks begin to convey the magnitude of pain and suffering inflicted by Long Covid. Along with the visualization, Giorgia contributes a guest essay that makes public many of the details of her journey for the first time, with the wish that it might help raise awareness and funding for the illness.
As Giorgia says in the piece, “We don’t have time. The longer a person’s body is in a state of chronic illness, the harder it is to fully recover.”
Giorgia continues to track her symptoms every day as she looks forward to a time when recording this data is no longer necessary. Until then, she hopes the Times essay reaches others who may be suffering from Long Covid and reminds them they are not alone.
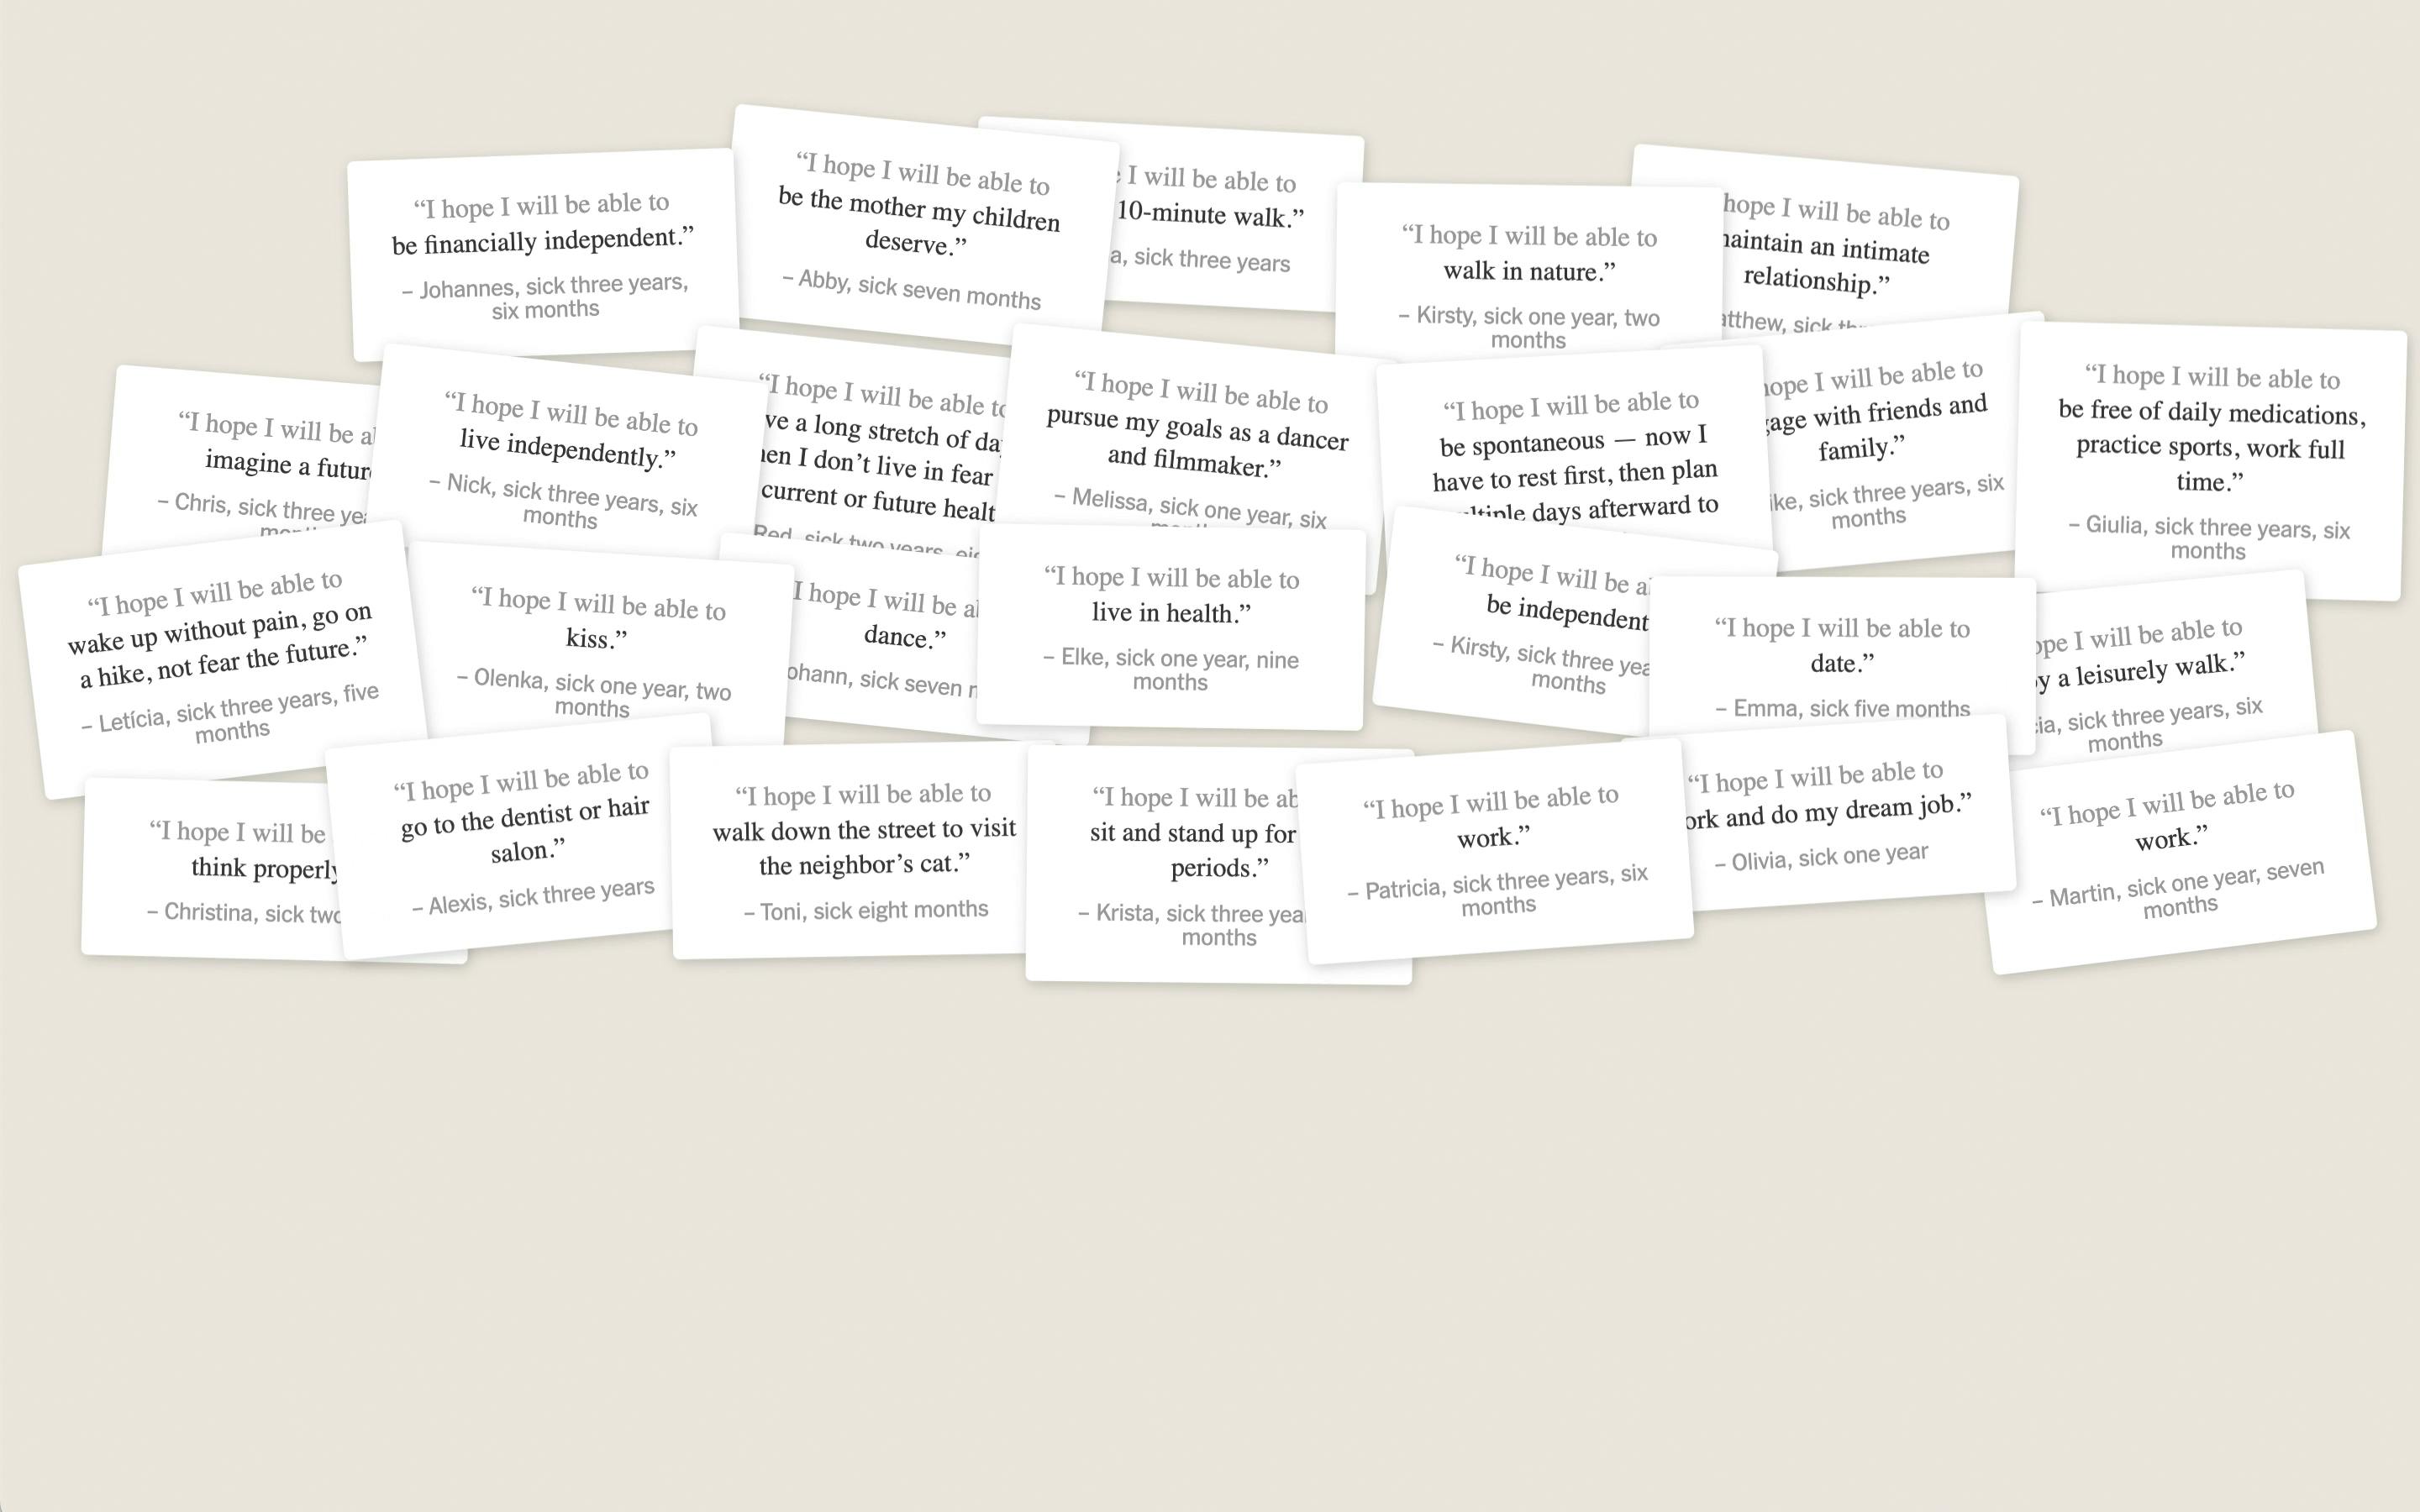
“Data is a tool that helps me cope with life when I am scared, confused, and looking for answers,” Giorgia writes. During the course of her ordeal, Giorgia has also been in close communication with and drawn support from the grassroots Long Covid community, and she and her team reached out to them for quotes about their hopes for the future. The team also contacted scientists and researchers for their perspectives.
There is a feeling within the Long Covid community that they have finally reached a ground-shifting collective moment as their different voices have come together to make themselves heard. Clinical trials and research studies are beginning, and Giorgia herself has participated in several. But progress is slow.
The self-initiated project started with a spreadsheet in which Giorgia would make detailed daily notations about her undiagnosed symptoms and their severity, the medications she took and the food she ate, and her triggers and tolerance for movement and activity. She gave her medical providers access to the chart to help formulate treatment plans. She also started sharing the spreadsheet with her design team to signal how she was feeling before work each day. Chiefly, the practice of logging her data gave her a sense of agency and control over the chaos and upheaval of the illness.
The initial sketches painted by hand became a computer generated data visualization from a data set of 21 different groups of symptoms (from the over 200 documented Long Covid symptoms experienced by Giorgia and others), with each represented by a different color and described in an accompanying legend.

Decimal
- Guillermo Brotons
- Nathan Gordon
- Gabrielle Harlid
- Kirsten Holland
- Nate Minnick
- Alex Muñoz
- Cherif Zouein
Pentagram
- Giorgia Lupi
- Phillip Cox
- Madeleine Garner
- Gabrielle Merite
- Jacopo Poletto
- Tommaso Renzini
- Julia Saimo
The New York Times
- Jeremy Ashkenas